


Measure AI search visibility with four separate layers: mentions, citations, referral visits, and business outcomes. They describe different events. Combining them into one headline number makes a report easier to sell and harder to trust.
This guide gives you definitions, formulas, and a reporting template you can use with a manual sample or a commercial platform. The calculations below are recommended reporting conventions; they are not official metrics shared by every AI engine.
Agree on these definitions before anyone starts work, including outside suppliers. If you use a managed service such as AEOFAST, settle up front how an observed result will be documented: the exact question, engine, date, answer, and supporting links. Distinguish evidence of a brand mention from evidence of a citation or customer acquisition.
Define the observation before calculating a rate
An observation is one completed answer to one recorded question in a specified engine and context at a particular time. Give it an ID and retain the response evidence.
Record failed attempts separately. If you scheduled 100 checks and 12 failed, report 88 completed observations plus 12 failures. Do not quietly count the failures as answers without a mention, or remove them without disclosure.
Keep location, language, search mode, account state, and question wording as consistent as practical. Some variables cannot be fully controlled. List those limits rather than presenting the sample as a census of what every user sees.
Use a small set of interpretable metrics
| Metric | Suggested calculation | What it cannot prove |
|---|---|---|
| Brand mention rate | Completed answers naming the brand ÷ completed answers | Recommendation quality or traffic |
| Owned-domain citation rate | Completed answers linking to your domain ÷ completed answers | Whether users noticed or clicked |
| Accurate-mention rate | Assessed mentions without material factual errors ÷ assessed mentions | Accuracy in unobserved answers |
| Qualified referral conversion rate | Qualified actions from identified AI referrals ÷ identified AI referral sessions | All AI-influenced conversions |
For a citation rate, count an answer once even if it contains three links to your domain. You may also track total citations, but label that a separate count. Otherwise a response with several links can distort a metric intended to represent coverage across questions.
Define a qualified action before reporting it. A newsletter signup, a demo request, and a sales-qualified opportunity are different outcomes. The definition should match the client’s commercial objective.
A worked example with honest denominators
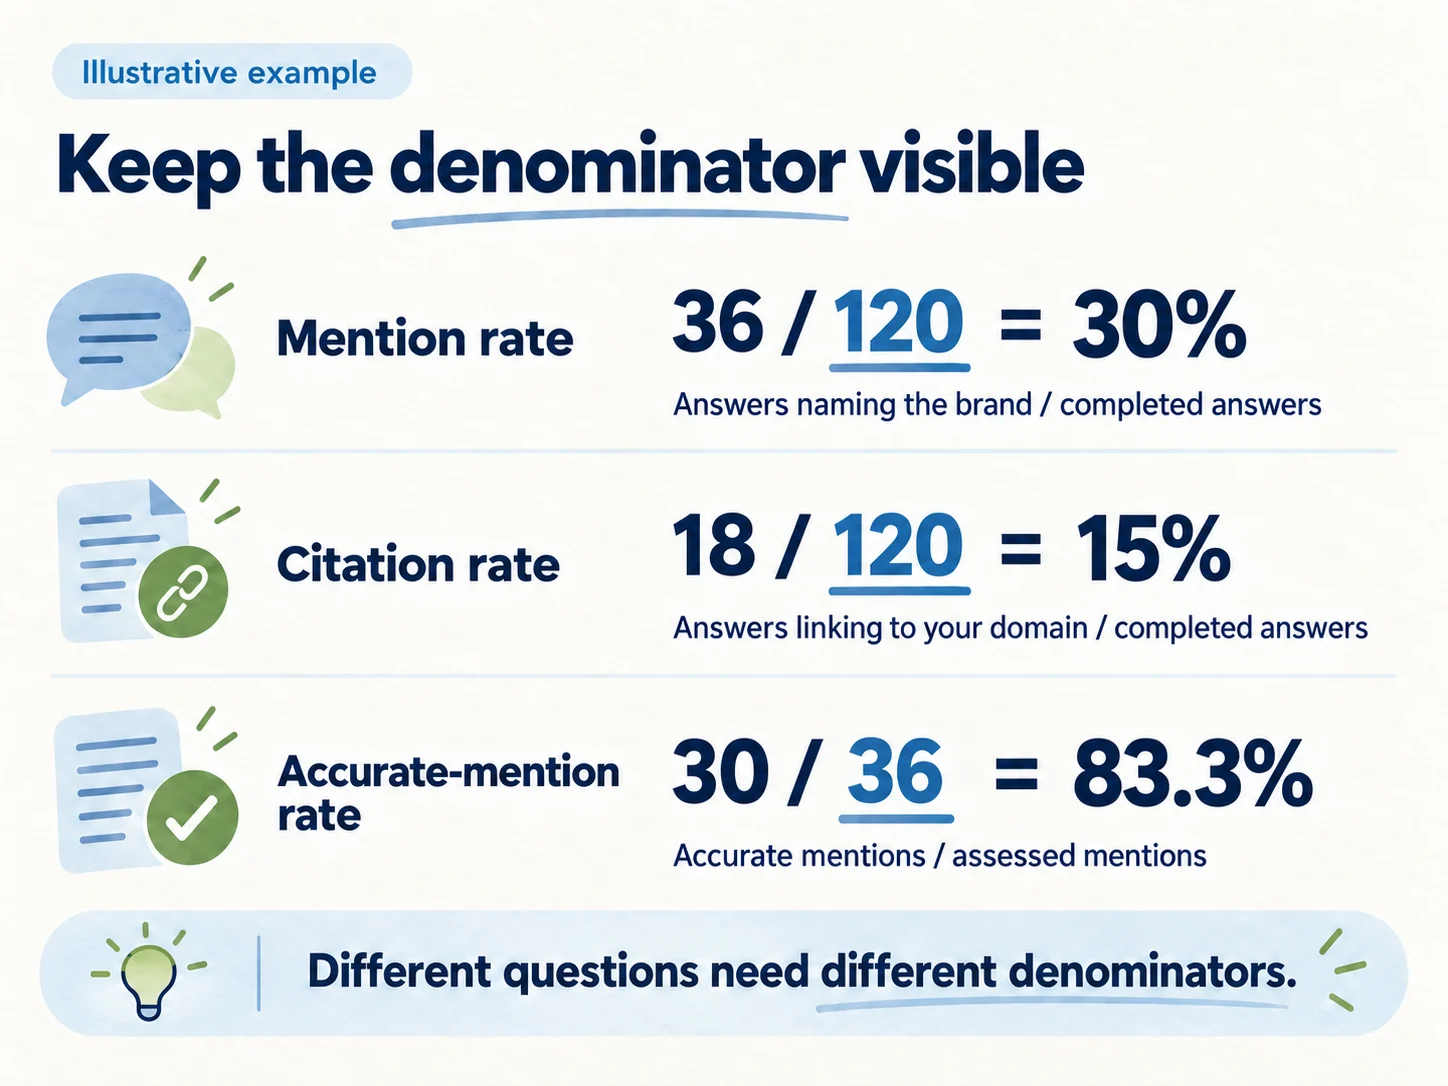
Imagine an illustrative sample of 120 completed answers. The brand appears in 36 answers, and its domain is cited in 18. Reviewers assess all 36 mentions and find 30 materially accurate. These are invented numbers used only to explain the arithmetic.
- Mention rate: 36 ÷ 120 = 30%.
- Owned-domain citation rate: 18 ÷ 120 = 15%.
- Accurate-mention rate: 30 ÷ 36 = 83.3%.
Suppose the previous period had a 20% mention rate with the same method. The increase is 10 percentage points, or 50% relative growth. Those are two descriptions of the same change; presenting “50% growth” without the starting value can exaggerate how broad the visibility is.
Now imagine eight identified referral sessions and one qualified enquiry. Report the counts before celebrating the conversion rate. A denominator of eight is too small to support a confident performance forecast.
How much uncertainty is in those numbers?
Most AI visibility reports print percentages without any sense of their precision. A simple 95% confidence interval (the Wilson method works well for small samples) shows how wide the plausible range is:
| Result | Point estimate | Approximate 95% interval |
|---|---|---|
| Mention rate, 36 of 120 | 30% | 22.5% to 38.7% |
| Previous mention rate, 24 of 120 | 20% | 13.8% to 28.0% |
| Citation rate, 18 of 120 | 15% | 9.7% to 22.5% |
| Accurate-mention rate, 30 of 36 | 83.3% | 68.1% to 92.1% |
| Qualified enquiry rate, 1 of 8 | 12.5% | 2.2% to 47.1% |
The intervals overlap. A standard two-proportion test on the 20% and 30% mention rates gives a p-value of about 0.07, so by the usual 95% convention this sample cannot confirm that visibility improved, even though the 10-point rise looks convincing. That does not mean nothing changed; it means the report should say “a likely improvement that needs another period to confirm”.
Two practical consequences follow. First, as a rough guide, estimating a rate near 30% to within about plus or minus 5 percentage points takes roughly 320 completed answers. Second, repeated runs of the same questions are not fully independent, so real uncertainty is usually somewhat wider than these formulas suggest. Report the interval or at least the raw counts, and save strong language for changes that persist across periods.
Keep first-party reports and sampled checks separate
Microsoft’s AI Performance reporting includes citations, cited pages, and sampled grounding-query information across supported experiences. Those observations have a different scope from a prompt list you run yourself.
Do not average their values together. A first-party report may cover a broad population of supported activity, while your manual sample covers a deliberately selected set of commercial questions. Both can be useful without being interchangeable.
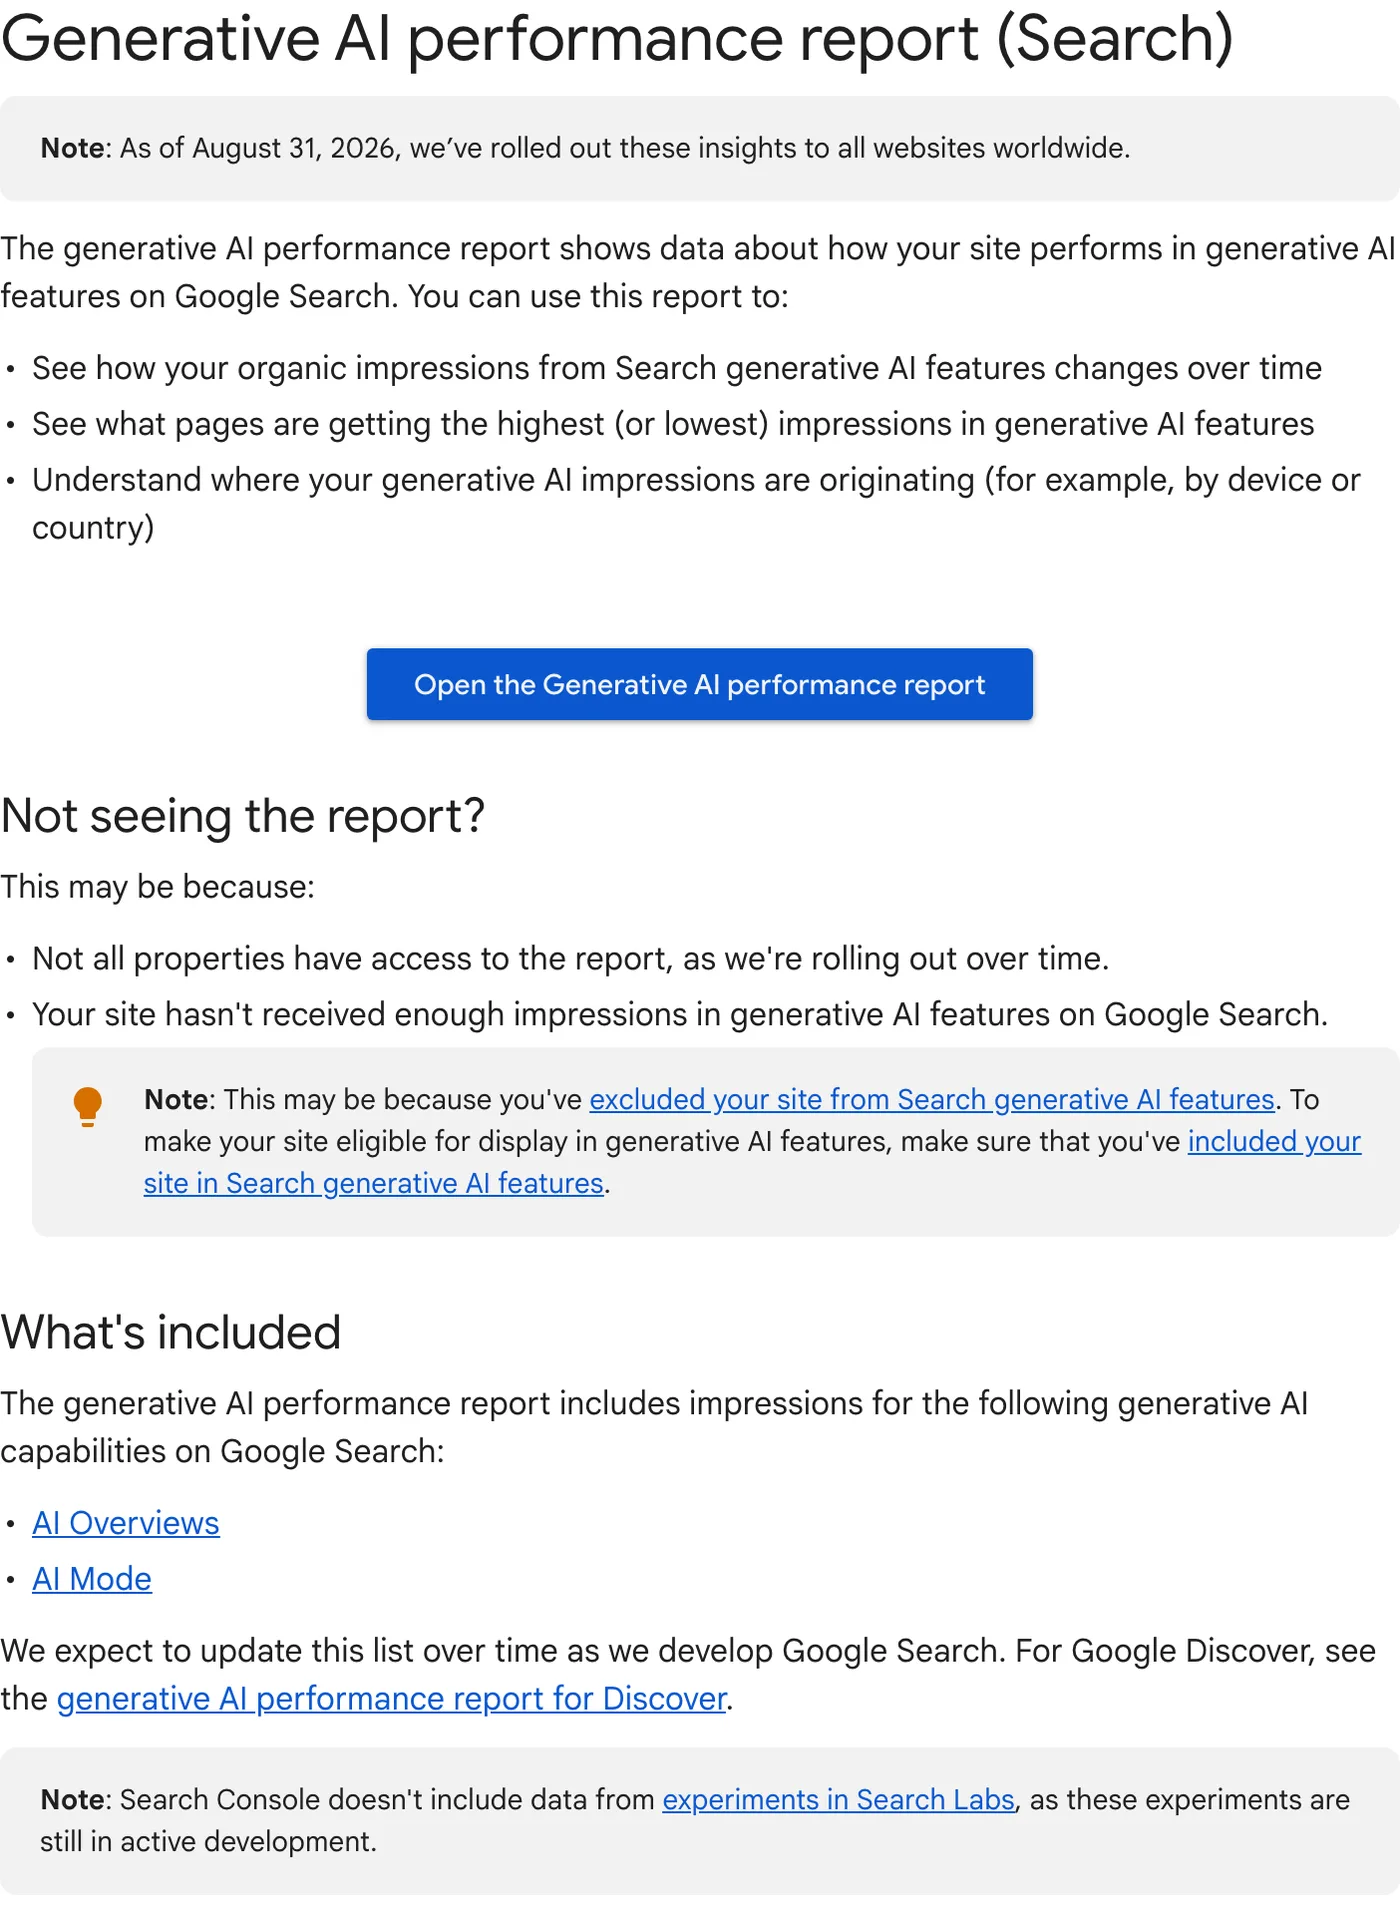
For Google, the main first-party source is now the Generative AI performance report in Search Console, available to all sites since 31 August 2026. It reports impressions in AI Overviews and AI Mode, grouped by page, country, date, or device. Several details change how you should read it:
- It is a subset, not an addition. Google states that the report’s data comes from the Web search type of the regular Performance report. Adding AI impressions to Performance report impressions double-counts them.
- The chart and table count differently. The chart aggregates by property, so two of your links in one AI answer count as one impression. The table, when grouped by page, counts each URL separately, so its totals can be higher.
- There is no query dimension. You can see which pages appear, not which questions triggered them.
- Exports turn gaps into zeros. Values shown as “~” or “-” in the interface become zeros in the downloaded file, which can look like a real drop in a spreadsheet chart.
- Dates use Pacific Time. Align them with your analytics time zone before comparing day by day.
Do not rename a general organic-traffic trend “AI revenue” unless the data actually supports that attribution. Reporting interfaces evolve, so retain the report name, export date, and metric definition with each export.
Track referrals, while acknowledging missing attribution
OpenAI’s publisher FAQ states that ChatGPT referral URLs include utm_source=chatgpt.com. Preserve campaign parameters through redirects and inspect the landing pages receiving those visits.
In your analytics system, verify how source and medium are classified rather than assuming all AI visits appear under one channel.
Google Analytics 4 now has an AI Assistant channel in its default channel group. When the referrer matches Google’s list of AI assistants, GA4 sets the medium to ai-assistant and the campaign to (ai-assistant). Google describes the channel as covering “sources like ChatGPT, Gemini, Deepseek, Copilot, or Grok” and does not publish the full list, so check your source report for assistants that still arrive as ordinary referrals, such as perplexity.ai or claude.ai, and add them to a custom channel group if they matter to you.
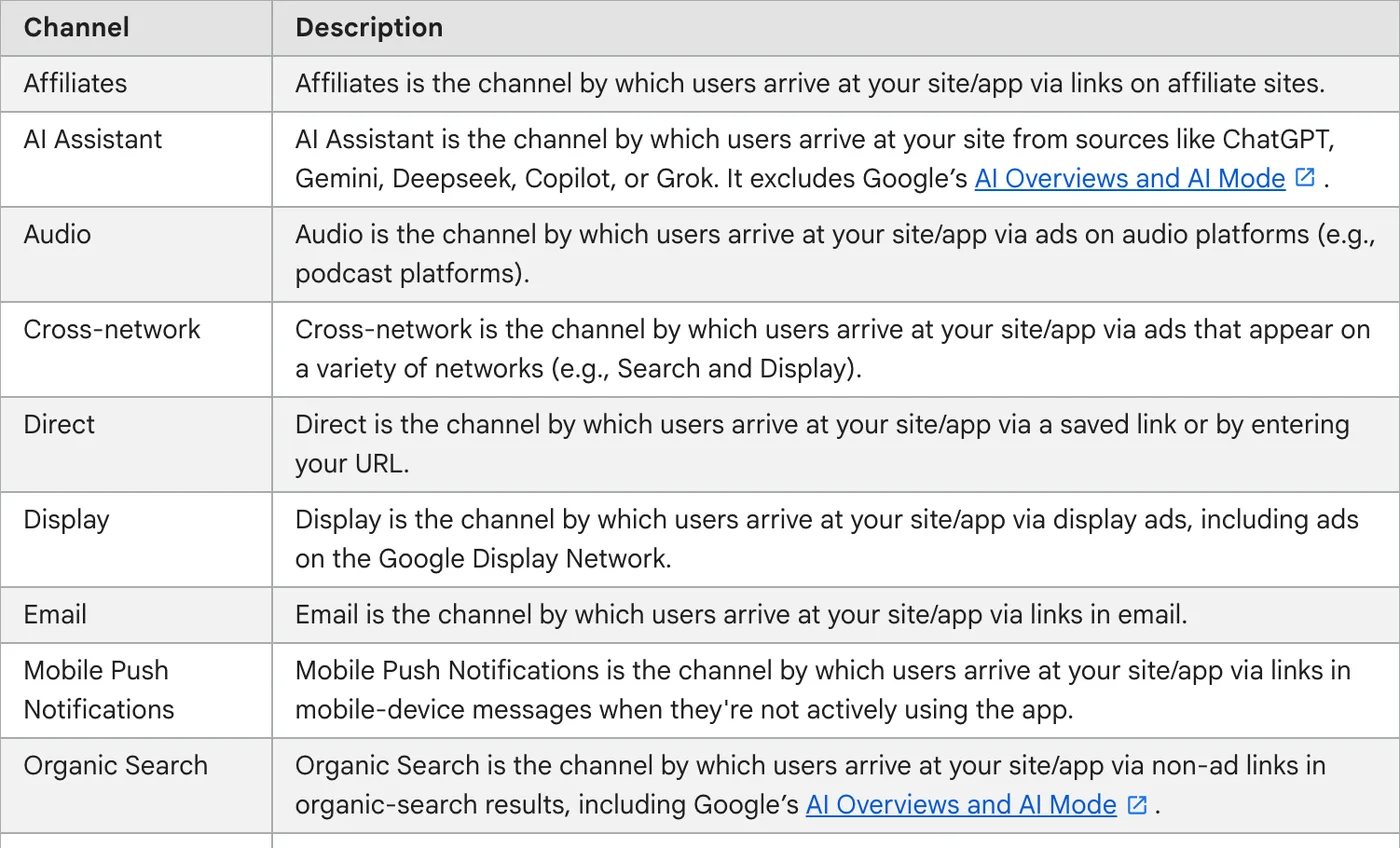
The same documentation contains an easily missed detail: clicks from Google’s AI Overviews and AI Mode are excluded from the AI Assistant channel and counted as Organic Search. GA4 cannot separate them from ordinary organic clicks, which is why the Search Console report above matters. A report that labels the AI Assistant channel “all AI traffic” understates AI’s role on Google and overstates the precision of the data. Test the redirect chain, consent behavior, and conversion event with a controlled visit that your team labels as a test.
A buyer may also read an answer and return through a bookmark, branded search, or direct visit. A “how did you hear about us?” field can supply additional context, but self-reported attribution has its own errors. Keep it alongside, rather than merged invisibly into, observed referral data.
Never claim that every increase in branded search was caused by AEO. Advertising, PR, email, seasonality, and word of mouth can produce the same pattern.
Review citation quality, not just citation quantity
Open a selection of cited pages and compare them with the actual statement they support. Check for stale prices, wrong geography, mismatched products, and claims that the source never made.
Classify each result into a useful action:
- Correct representation: preserve the supporting page and keep it current.
- Incomplete representation: add the missing condition where it belongs.
- Incorrect representation: locate and correct the source conflict.
- Irrelevant mention: exclude it from commercial success claims.
An answer that recommends a business for a service it does not offer can create costly enquiries. Counting that as a win encourages the wrong work.
A one-page reporting format
Start the report with the business question: “Are more relevant buyers encountering accurate information about this offer?” Then include:
- Scope: dates, markets, engines, questions, completed checks, failed checks.
- Visibility: mention and owned-citation rates with numerators and denominators.
- Quality: material errors, recurring omissions, and representative evidence.
- Traffic: identified referral sessions and their landing pages.
- Outcomes: qualified enquiries or other agreed actions, including small-sample limits.
- Interventions: pages and facts changed during the period.
- Next decision: continue, revise, investigate, or stop a specific task.
Put a positive example and a negative example beside the summary. This reduces the temptation to select only flattering screenshots.
Evaluate suppliers using the same definitions
Hold every supplier, including the managed service mentioned at the start of this guide, to the documentation standard agreed before work starts. Ask for raw counts and denominators, not only percentages, and ask how failed checks were handled.
If a platform such as SurgeGraph organizes your AI visibility workflow, preserve the metric definitions and sample settings when exporting reports. A change of tool or sampling method can create a break in the trend even when the underlying business has not changed.
What should count as progress?
Look for a coherent pattern: fewer factual errors, better coverage of meaningful questions, useful referral visits, and qualified outcomes. None needs to rise on every check.
Use the AI visibility audit worksheet to collect the evidence, and the 30-day agency pilot framework to turn it into a decision. A report should help you choose the next action, not simply prove that the previous invoice was justified.
Questions teams commonly ask
Can we add Bing citations and Google AI impressions into one number?
No. A Bing citation counts a page displayed as a source in an AI answer; a Google impression counts a link shown to a user in an AI feature. They measure different events with different coverage. Report them side by side.
How often should we report?
Monthly is usually enough for first-party reports and referral data. Sampled answer checks need enough observations per period to be meaningful, so a quarterly comparison with a monthly progress note is often more honest than a noisy monthly rate.
What if the AI Assistant channel shows almost no traffic?
That is common and not necessarily bad news. Many people read an AI answer without clicking, and visits from in-app browsers can arrive without a referrer and land in Direct. Combine referral data with the first-party citation and impression reports before concluding that AI visibility has no value.
Leave a Reply